Eosin-Y-dextran 10
Eosin-Y-dextran 10
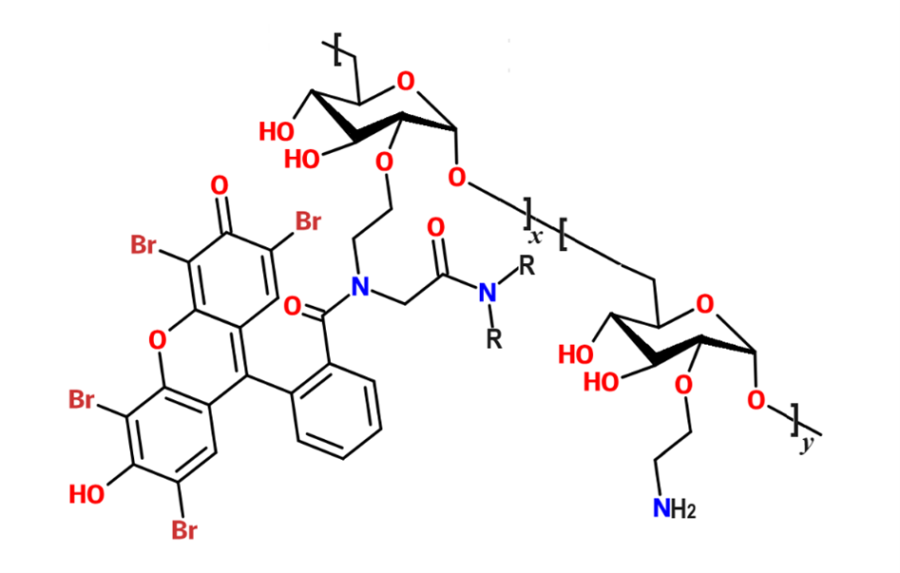
Fig. 1 Structure of Eosin-Y-dextran 10 kDa (ratio x/y depends on the load of fluorescent labelling; R bulky substituent not displayed).
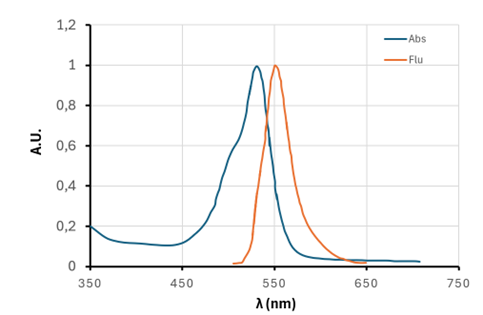
Fig. 2 Absorbance and fluorescence spectra of EYD10 recorded in borate buffer (pH=7.0).
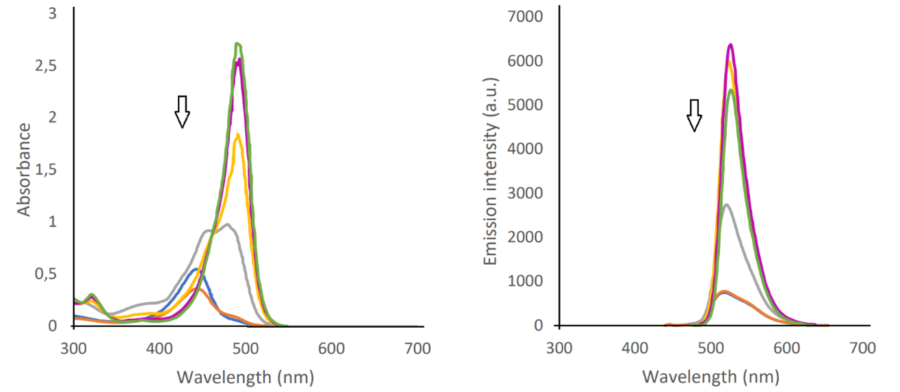
Fig. 3 Spectrophotometry experiments indicating the dependence on pH of absorbance (left) and emission (right) spectra of EYD10 recorded in water at 25oC. Arrows indicate the observed decrease of absorbance or emission intensity upon pH decrease from 9 to 1.
Technical information
Specifications