Eosin-Y-lysine-dextran 500
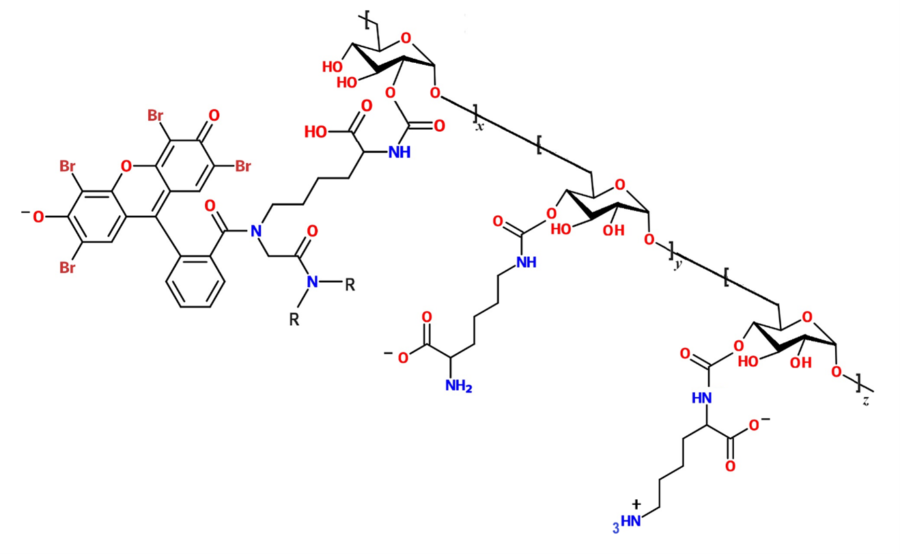
Fig. 1 Structure of Eosin-Y-lysine-dextran 500 kDa (ratio x/(y+z) depends on the load of fluorescent labelling; R bulky substituent not displayed).
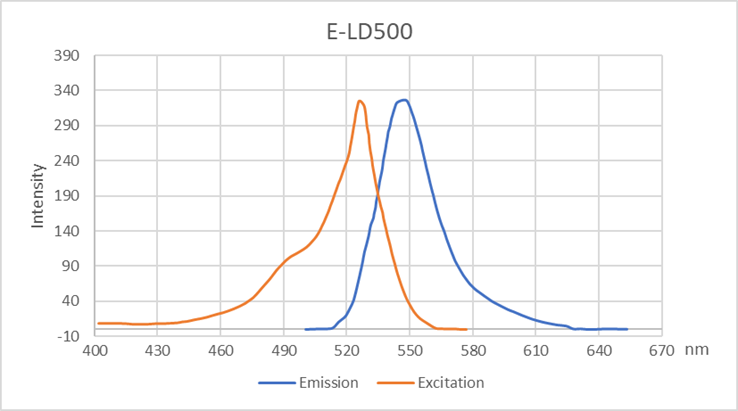
Fig. 2 Excitation and fluorescence spectra of EYLD500 recorded in borate buffer (pH=7.0).
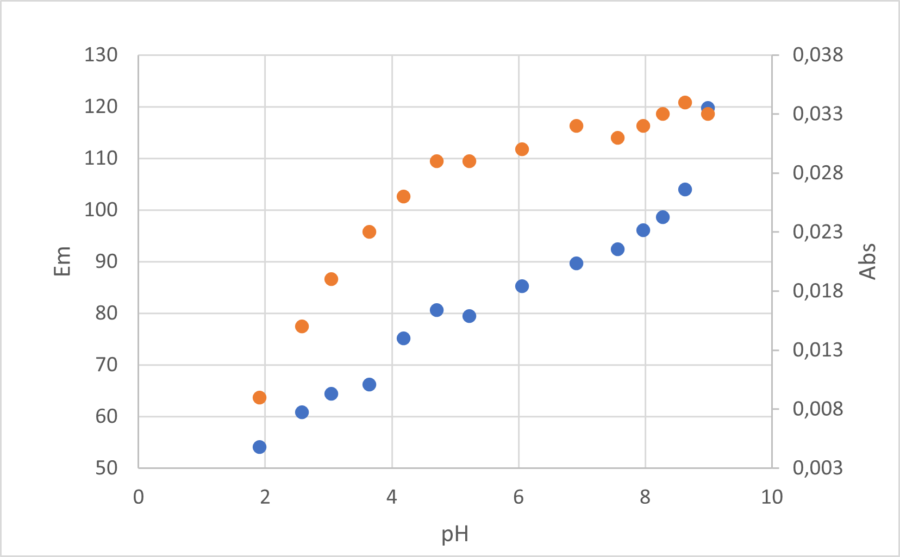
Fig. 3 Sigmoidal curves obtained from the results of titration experiments on EYLD500 indicating a high sensitivity to pH (absorbance: orange dots, emission: blue dots) in the range from 1 to 4 (Y-axis corresponds to the product of maximal absorbance or maximal emission intensity of EYLD500).
Technical information
Specifications