FITC-Antonia Red-dextran 20
FITC-Antonia Red-dextran 20
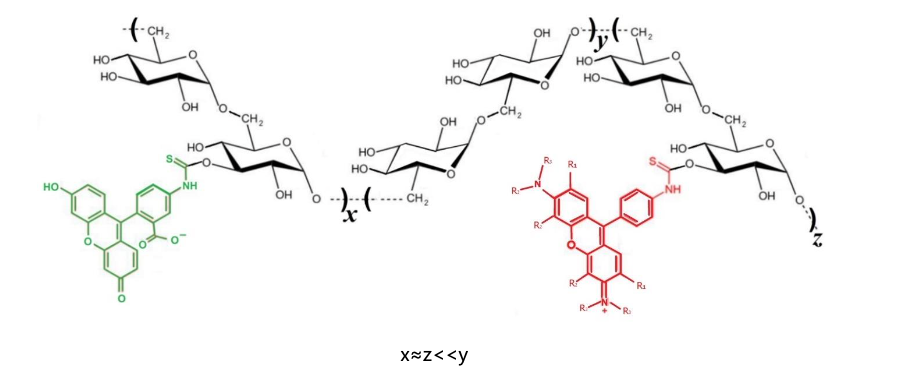
Fig 1. Structural representation of FITC-Antonia Red-dextran (FARD)
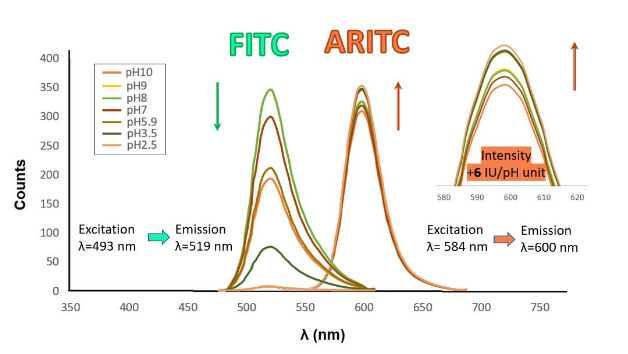
Fig 2. UV-Vis spectra depicting the dependence of two visible features of FARD upon varying pH
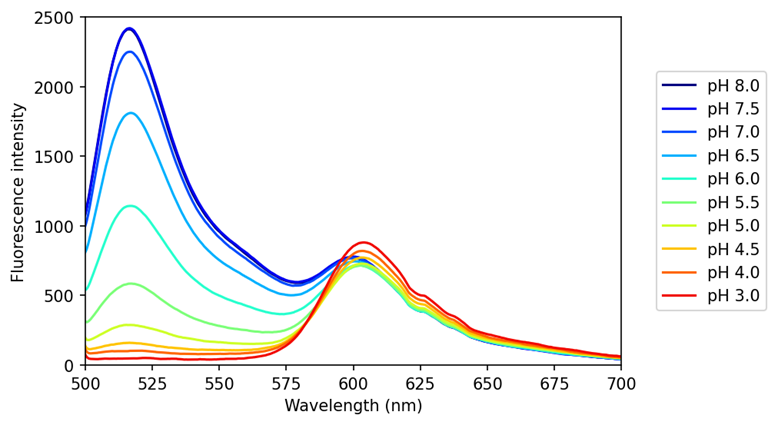
Fig 3. Emission spectra of the pH probe FARD20 recorded at different pH values
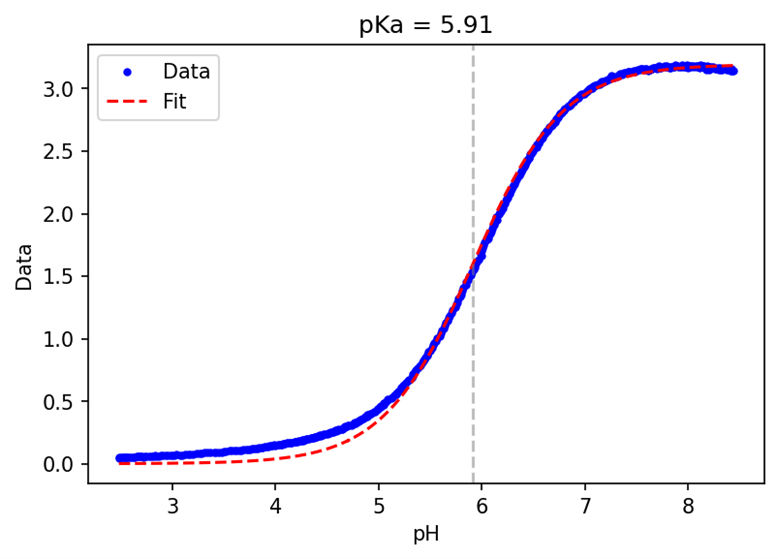
Fig 4. Plot of ratio between the two fluorescent peaks of FARD20 (blue circles), with an accompanying fit to the Henderson-Hasselbalch equation (red dashes)
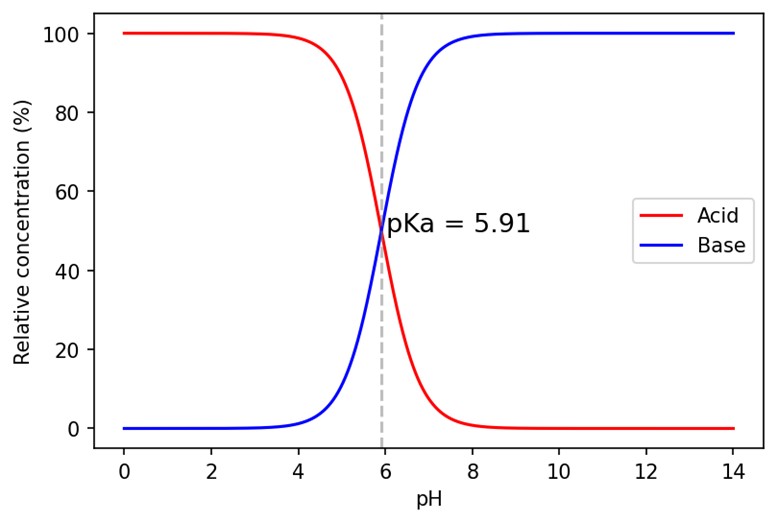
Fig 5. Plot depicting the relative concentration of the acid/base form of FARD20
Technical information
Specifications